FY
2011
Rank |
Organization |
Number FOIA Requests Received |
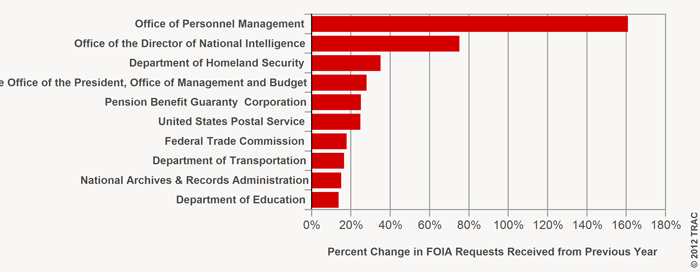
Percent Change |
| FY 2010 |
FY 2011 |
FY 2011 vs. FY 2010 |
|
Total (All Agencies) |
597,415 |
644,165 |
7.8% |
| 1 |
Office of Personnel Management |
3,009 |
7,844 |
160.7% |
| 2 |
Office of the Director of National Intelligence |
221 |
387 |
75.1% |
| 3 |
Department of Homeland Security |
130,098 |
175,656 |
35.0% |
| 4 |
Executive Office of the President, Office of Management and Budget |
147 |
188 |
27.9% |
| 5 |
Pension Benefit Guaranty Corporation |
5,834 |
7,291 |
25.0% |
| 6 |
United States Postal Service |
2,008 |
2,504 |
24.7% |
| 7 |
Federal Trade Commission |
1,294 |
1,523 |
17.7% |
| 8 |
Department of Transportation |
10,363 |
12,064 |
16.4% |
| 9 |
National Archives & Records Administration |
15,781 |
18,129 |
14.9% |
| 10 |
Department of Education |
2,114 |
2,401 |
13.6% |
| 11 |
U.S. Department of Agriculture |
20,368 |
23,065 |
13.2% |
| 12 |
United States Equal Employment Opportunity Commission |
16,652 |
18,424 |
10.6% |
| 13 |
Securities and Exchange Commission |
10,461 |
11,555 |
10.5% |
| 14 |
U.S Office of Special Counsel |
120 |
132 |
10.0% |
| 15 |
Federal Reserve Board |
757 |
823 |
8.7% |
| 16 |
Federal Housing Finance Agency |
116 |
125 |
7.8% |
| 17 |
U.S. Nuclear Regulatory Commission |
342 |
365 |
6.7% |
| 18 |
Commodity Futures Trading Commission |
158 |
168 |
6.3% |
| 19 |
Tennessee Valley Authority |
165 |
175 |
6.1% |
| 20 |
Central Intelligence Agency |
3,094 |
3,269 |
5.7% |
| 21 |
Department of Health and Human Services |
63,839 |
67,431 |
5.6% |
| 22 |
National Science Foundation |
500 |
526 |
5.2% |
| 23 |
Court Services and Offender Supervision Agency |
719 |
756 |
5.1% |
| 24 |
Department of Energy |
2,206 |
2,315 |
4.9% |
| 25 |
Department of Commerce |
2,113 |
2,202 |
4.2% |
| 26 |
U.S. Department of Labor |
17,398 |
18,012 |
3.5% |
| 27 |
United States Agency for International Development |
286 |
296 |
3.5% |
| 28 |
National Credit Union Administration |
163 |
165 |
1.2% |
| 29 |
Department of Defense |
73,573 |
74,117 |
0.7% |
| 30 |
Federal Communications Commission |
593 |
590 |
-0.5% |
| 31 |
National Labor Relations Board |
5,905 |
5,875 |
-0.5% |
| 32 |
United States Department of the Treasury |
16,911 |
16,776 |
-0.8% |
| 33 |
U.S. Small Business Administration |
3,162 |
3,135 |
-0.9% |
| 34 |
U.S. Department of Justice |
63,682 |
63,103 |
-0.9% |
| 35 |
Social Security Administration |
32,997 |
32,456 |
-1.6% |
| 36 |
U.S. Environmental Protection Agency |
10,409 |
10,123 |
-2.7% |
| 37 |
National Aeronautics and Space Administration (NASA) |
1,058 |
1,026 |
-3.0% |
| 38 |
Office of Navajo and Hopi Indian Relocation |
122 |
117 |
-4.1% |
| 39 |
National Endowment for the Arts |
146 |
139 |
-4.8% |
| 40 |
Department of Veterans Affairs |
29,127 |
27,655 |
-5.1% |
| 41 |
U.S. Department of the Interior |
6,127 |
5,809 |
-5.2% |
| 42 |
National Transportation Safety Board |
315 |
293 |
-7.0% |
| 43 |
Department of Housing and Urban Development |
3,053 |
2,828 |
-7.4% |
| 44 |
Peace Corps |
198 |
182 |
-8.1% |
| 45 |
U.S. General Services Administration |
1,730 |
1,564 |
-9.6% |
| 46 |
Railroad Retirement Board |
120 |
105 |
-12.5% |
| 47 |
National Railroad Passenger Corporation |
203 |
172 |
-15.3% |
| 48 |
U.S. Consumer Product Safety Commission |
3,220 |
2,545 |
-21.0% |
| 49 |
Federal Labor Relations Authority |
109 |
86 |
-21.1% |
| 50 |
Federal Energy Regulatory Commission |
103 |
81 |
-21.4% |
| 51 |
Federal Mediation and Conciliation Service |
142 |
110 |
-22.5% |
| 52 |
Federal Deposit Insurance Corporation |
1,987 |
1,250 |
-37.1% |
| 53 |
Department of State |
30,206 |
14,298 |
-52.7% |
| 54 |
Merit Systems Protection Board |
400 |
121 |
-69.8% |
| Not Ranked: Agencies with fewer than 100 FOIA requests in FY 2010 in name order |
|
|
|
|
Administrative Conference of the U.S. |
2 |
7 |
250.0% |
|
African Development Foundation |
4 |
9 |
125.0% |
|
American Battle Monument Commission |
17 |
26 |
52.9% |
|
Armed Forces Retirement Home |
– |
4 |
– |
|
Broadcasting Board of Governors |
40 |
75 |
87.5% |
|
Chemical Safety and Hazard Investigation Board |
36 |
48 |
33.3% |
|
Committee for Purchase From People Who Are Blind or Severely Disabled |
12 |
20 |
66.7% |
|
Corporation for National and Community Service |
69 |
69 |
0.0% |
|
Council of the Inspectors General on Integrity and Efficiency |
2 |
23 |
1050.0% |
|
Council on Environmental Quality |
25 |
41 |
64.0% |
|
Defense Nuclear Facilities Safety Board |
19 |
24 |
26.3% |
|
Export-Import Bank of the United States |
96 |
100 |
4.2% |
|
Farm Credit Administration |
27 |
36 |
33.3% |
|
Farm Credit System Insurance Corporation |
8 |
11 |
37.5% |
|
Federal Election Commission |
77 |
83 |
7.8% |
|
Federal Financial Institutions Council |
24 |
24 |
0.0% |
|
Federal Maritime Commission |
37 |
39 |
5.4% |
|
Federal Mine Safety and Health Review Commission |
98 |
185 |
88.8% |
|
Federal Open Market Committee |
30 |
35 |
16.7% |
|
Federal Retirement Thrift Investment Board |
22 |
24 |
9.1% |
|
Institute of Museum and Library Services |
49 |
40 |
-18.4% |
|
Inter-American Foundation |
9 |
16 |
77.8% |
|
Legal Services Corporation |
35 |
34 |
-2.9% |
|
Millennium Challenge Corporation |
22 |
26 |
18.2% |
|
National Capital Planning Commission |
19 |
17 |
-10.5% |
|
National Endowment for the Humanities |
52 |
48 |
-7.7% |
|
National Indian Gaming Commission |
70 |
76 |
8.6% |
|
National Mediation Board |
28 |
29 |
3.6% |
|
Occupational Safety and Health Review Commission |
61 |
76 |
24.6% |
|
Office of National Drug Control Policy |
19 |
32 |
68.4% |
|
Office of Science and Technology Policy |
44 |
52 |
18.2% |
|
Office of the U.S. Trade Representative |
41 |
59 |
43.9% |
|
Overseas Private Investment Corporation |
44 |
45 |
2.3% |
|
Postal Regulatory Commission |
30 |
29 |
-3.3% |
|
Recovery Accountability and Transparency Board |
– |
19 |
– |
|
Selective Service System |
37 |
18 |
-51.4% |
|
Special Inspector General for Afghanistan Reconstruction |
4 |
18 |
350.0% |
|
Special Inspector General for Iraq Reconstruction |
16 |
14 |
-12.5% |
|
Surface Transportation Board |
7 |
38 |
442.9% |
|
The U.S. Copyright Office |
36 |
44 |
22.2% |
|
U.S. Office of Government Ethics |
89 |
69 |
-22.5% |
|
U.S. Trade and Development Agency |
21 |
28 |
33.3% |
|
United States Commission on Civil Rights |
40 |
50 |
25.0% |
|
United States International Trade Commission |
46 |
34 |
-26.1% |
|
Unites States Section, International Boundary and Water Commission |
27 |
24 |
-11.1% |
 Recent Tweets

